Vegetation phenology

Phenology is the response of biological organisms to seasonal variations in environmental factors like light, temperature and precipitation. Changing growing seasons are important indicators of changes in the climate system. Also short-term variations may indicate disturbances that may seriously affect production and health of the vegetation. We use satellite remote sensing for monitoring phenology, as a way of improving our knowledge concerning vegetation-climate interactions. We carry out a number of activities including spectral measurements, use of phenology cameras, model development, use or carbon flux measurements, and processing of MODIS and Sentinel-2 satellite data. NDVI, PPI (see below) and other vegetation indices are tested for monitoring the phenology of different ecosystems.
Research activities
- Development of a new vegetation index (PPI) for better description of phenology from Earth observation data (see below).
- Development of time-series methods for studying phenology in Earth observation data. For further information on time-series analysis, visit this page.
- Studying changes in plant phenology in different ecosystems (sub-arctic, boreal, temperate and semi-arid), and relationships with climate variations
- Monitoring plant water status using Vegetation Optical Depth (VOD) from passive microwave satellite sensors
VOD was found to be linearly correlated with vegetation water content from both green and woody components, dependent on the microwave frequency. Thus periodical VOD observations were used as a proxy for plant water status, from which vegetation phenology can be assessed from the perspective of water content. Seasonal variations in SMOS L-band VOD (L-VOD) were found to be synchronous with leaf area index for the boreal and temperate forests, but highly asynchronous for the tropical woodlands, indicating different strategies of the coupling between plant water storage and leaf phenology (Tian et al. 2018).
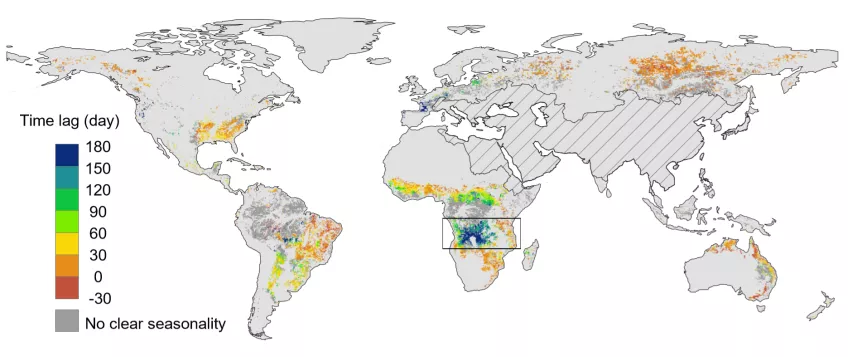
Lag time for L-VOD to obtain the highest correlation with LAI for pixels with clear seasonality. Areas influenced by RFI are marked with hatching.
Plant Phenology Index (PPI)
Why a new vegetation index?
Vegetation phenology is difficult to observe from satellite, particularly in boreal landscapes. Currently existing vegetation indices are generally insensitivet to the seasonal variation in dense coniferous canopies. Another problem is snow, which interferes with measurements duing spring and autumn (Jönsson et al. 2010).
About the Plant Phenology Index
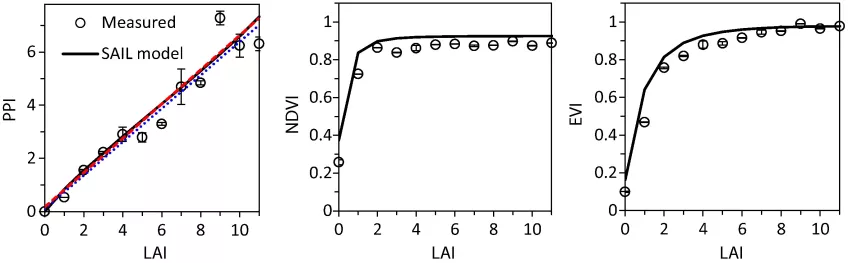
The PPI is a physically-based new vegetation index for characterizing terrestrial vegetation canopy green leaf area dynamics. PPI is derived from the solution to a radiative transfer equation, is computed from red and near-infrared (NIR) reflectance, and has a nearly linear relationship with canopy green leaf area index (LAI), enabling it to depict canopy foliage density well. This capability is verified with stacked-leaf measurements, canopy reflectance model simulations, and field LAI measurements from international sites. Snow influence on PPI is shown by modeling and satellite observations to be less severe than on the Normalized Difference Vegetation Index (NDVI) or the Enhanced Vegetation Index (EVI), while soil brightness variations in general have moderate influence on PPI. Comparison of satellite-derived PPI to ground observations of plant phenology and gross primary productivity (GPP) shows strong similarity of temporal patterns over several Nordic boreal forest sites. The proposed PPI can thus serve as an efficient tool for estimating plant canopy growth, and will enable improved vegetation monitoring, particularly of evergreen needle-leaf forest phenology at high northern latitudes.
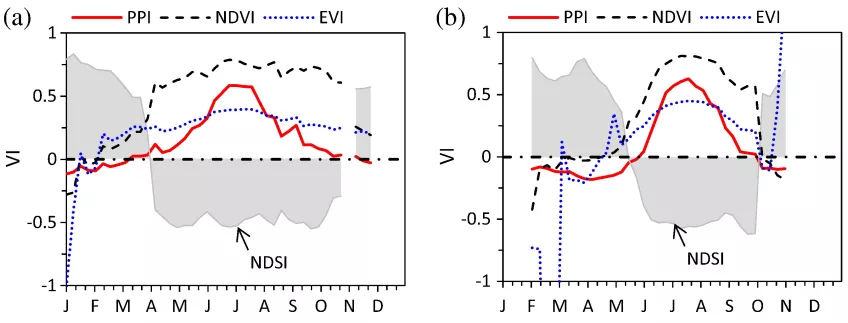
This figure shows that PPI is minimally affected by snow:
This figure shows that PPI is minimally affected by snow:
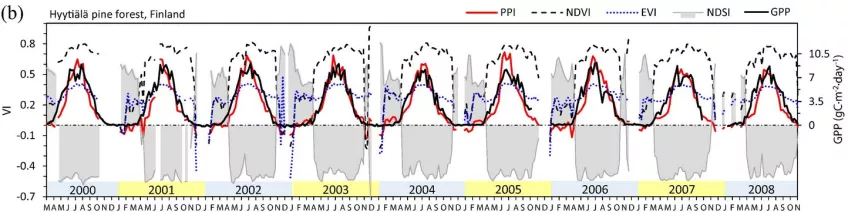
This figure shows that PPI is strongly related to coniferous GPP, estimated with carbon flux data:
References
- Jin H. and Eklundh L. (2014) A physically based vegetation index for improved monitoring of plant phenology. Remote Sensing of Environment 152, 512-525. http://www.sciencedirect.com/science/article/pii/S0034425714002557
- Jönsson A.M., Eklundh L., Hellström M., Bärring L. and Jönsson P. (2010) Annual changes in MODIS vegetation indices of Swedish coniferous forests in relation to snow dynamics and tree phenology. Remote Sensing of Environment 114, 2719-2730. http://www.sciencedirect.com/science/article/pii/S0034425710001951
- Tian, F., Wigneron, J. P., Ciais, P., Chave, J., Ogée, J., Peñuelas, J., Ræbild, A., Domec, J., Tong, X., Brandt, M., Mialon, A., Rodriguez-Fernandez, N., Tagesson, T., Al-Yaari, A., Chi Chen, Y., Myneni, R., Zhang, W., Ardö, J. & Fensholt, R. (2018). Coupling of ecosystem-scale plant water storage and leaf phenology observed by satellite. Nature ecology & evolution. https://www.nature.com/articles/s41559-018-0630-3
Contact information
Lars Eklundh
lars [dot] eklundh [at] nateko [dot] lu [dot] se
Phone: +46462229655