Time series analysis in remote sensing
In order to handle and analyze satellite data time-series, we developed TIMESAT (Jönsson and Eklundh, 2002, 2004). The TIMESAT software package provides tools that allow modeling of seasonality patterns of vegetation and the investigation of the relationship between satellite derived parameters and dynamic properties of vegetation, such as phenology and temporal development.
TIMESAT was originally intended for handling noisy time-series of AVHRR NDVI data and to extract seasonality information from the data. The program now has the capability to handle different types of remotely sensed time-series, e.g. data from Terra/MODIS. It has also been tested with eddy covariance data and moisture data, although these applications are not the main target. A recent analysis of TIMESAT demonstrates its performance for smoothing different types of satellite data (Cai et al. 2017). More information on TIMESAT.
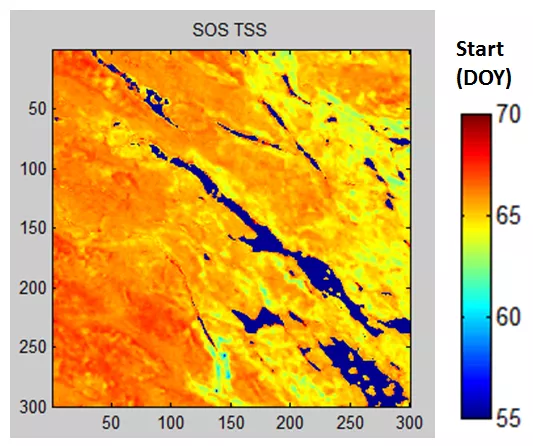
Part of our research includes the development and testing of methodology for the monitoring of vegetation seasonality at moderate spatial resolution (10 – 30 m) from Landsat and Sentinel-2 data, and for the assessment of the scientific value of these products, regarding vegetation phenology and carbon uptake by land vegetation. For that purpose we have developed a new software version based on the existing TIMESAT platform. The platform was modified in several respects, in order to allow for accurate and rapid analysis of data, and was optimized for Sentinel-2 data, with respect to accuracy and speed (Jönsson et al. 2018). In order to calibrate and validate the new methods, we utilized data from an existing network of optical sensors, with year-round multispectral measurements, that took place in the Nordic countries and in Africa.
We are now developing and testing our methods with two application areas in mind: phenology and carbon uptake by land vegetation. With respect to phenology, there is high possibility to calibrate satellite measurements against ground observations that are particularly important. Spectral measurements, as well as manual field observations of phenology, are generally carried out in areas that are too small for coarse-resolution satellites, but match the pixel size of the Sentinel-2 very well. We expect that this improved matching will improve the precision of phenological parameter extraction, to enable better understanding of climate-vegetation interactions.
Carbon uptake, estimated from flux tower measurements, is the other field where we think important breakthroughs can be made with Sentinel-2. So far, the footprint areas of the flux-towers have not been properly characterized with respect to seasonal vegetation development. However, with the Sentinel-2 data, the footprint areas can be accurately modeled and a better understanding of the carbon flux data can be achieved.
Trend analysis
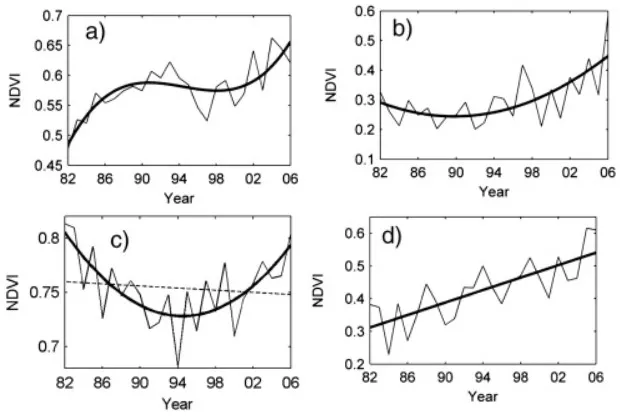
As we are interested in managing long time series, and have studied how the spatial domain can increase accuracy of estimated trend parameters (Bolin et al. 2009), we also develop trend analysis methodology for accurate description of non-linear trends (Jamali et al. 2014, 2015). These methods are powerful for understanding environmental changes and their causes and consequences.
PolyTrend
PolyTrend is a polynomial fitting-based algorithm for classifying trend in time series of satellite vegetation data. It classifies the trends into linear, quadratic, cubic, concealed, and no-trend types. The "concealed trends" are those trends that possess quadratic or cubic forms, but the net change from the start of the time period to the end of the time period hasn't been significant. The "no-trend" category includes simple linear trends with statistically insignificant slope coefficient.
How to get PolyTrend?
- Web-App: http://polytrend.gis.lu.se/
- R Software: CRAN – PolyTrend: https://cran.r-project.org/web/packages/PolyTrend/index.html
- PolyTrend code in MATLAB & R
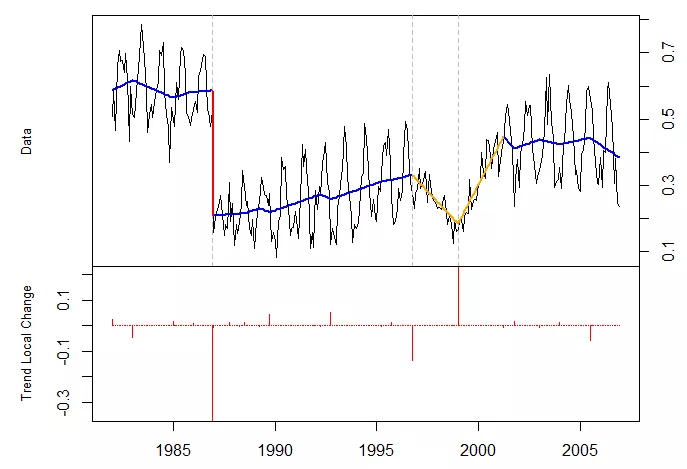
DBEST
DBEST (Detecting Breakpoints and Estimating Segments in Trend): is a program for analysing change in time series of satellite vegetation data. It has two main algorithms:
- change detection algorithm: that detects changes in trend, determines type of the changes (abrupt or gradual), and estimates timing, magnitude, number, and direction of the changes;
- generalization algorithm: that simplifies trend into main features.
The user can set the number of breakpoints or magnitude of greatest changes of interest for detection, and can control the generalization process by setting an additional parameter of generalization-percentage.
How to get DBEST?
- R Software: CRAN – Package DBEST.
- MATLAB code: contact sadegh [dot] jamali [at] tft [dot] lth [dot] se (Sadegh Jamali).
References
Bolin, D., Lindström, J., Eklundh, L. and Lindgren, F., 2009, Fast estimation of spatially dependent temporal vegetation trends using Gaussian Markov Random Fields. Computational Statistics and Data Analysis, 53, 2885-2896.http://dx.doi.org/10.1016/j.csda.2008.09.017
Cai, Z., Jönsson, P., Jin, H., & Eklundh, L. (2017). Performance of Smoothing Methods for Reconstructing NDVI Time-Series and Estimating Vegetation Phenology from MODIS Data. Remote Sensing, 9(12), 1271.
Eklundh, L. and Jönsson, P., 2013, A new spatio-temporal smoother for extracting vegetation seasonality with TIMESAT, The 35th International Symposium on Remote Sensing of Environment, 22-26 April 2013, Beijing, China.
Eklundh, L., Sjöström, M., Ardö, J. and Jönsson, P., 2012, High resolution mapping of vegetation dynamics from Sentinel-2, Proceedings of the First Sentinel-2 Preparatory Symposium, 23-27 April 2012, Frascati, Italy.
Jamali S., Jönsson P., Eklundh L., Ardö J., and Seaquist J., 2015, Detecting changes in vegetation trends using time series segmentation. Remote Sensing of Environment, 156, 182-195. http://dx.doi.org/10.1016/j.rse.2014.09.010
Jamali S., Seaquist J., Eklundh L. and Ardö J., 2014, Automated mapping of vegetation trends with polynomials using NDVI imagery over the Sahel. Remote Sensing of Environment 141, 79-89. http://dx.doi.org/10.1016/j.rse.2013.10.019
Jönsson, P., Cai, Z., Melaas, E., Friedl, M. A., & Eklundh, L. (2018). A Method for Robust Estimation of Vegetation Seasonality from Landsat and Sentinel-2 Time Series Data. Remote Sensing, 10(4), 635. http://www.mdpi.com/2072-4292/10/4/635
Jönsson, P. and Eklundh, L., 2002, Seasonality extraction by function fitting to time-series of satellite sensor data. IEEE Transactions on Geoscience and Remote Sensing, 40, 1824-1832.
Jönsson, P. and Eklundh, L., 2004, TIMESAT - a program for analysing time-series of satellite sensor data. Computers and Geosciences, 30, 833-845.
Olsson, L. and Eklundh, L., 1994, Fourier transformation for analysis of temporal sequences of satellite imagery. International Journal of Remote Sensing, 15, 3735-3741.
Tomov H (2016). Automated temporal NDVI analysis over the Middle East for the period 1982 – 2010, http://lup.lub.lu.se/student-papers/record/8871893.
Wei, Yufei (2016) Developing a web-based system to visualize vegetation trends by a nonlinear regression algorithm, https://lup.lub.lu.se/student-papers/search/publication/8882588.
Contact information
Lars Eklundh
lars [dot] eklundh [at] nateko [dot] lu [dot] se
Phone: +46462229655