Monitoring trends and tipping points in phenology from NDVI data
Monitoring trends and tipping points in phenology from NDVI data and their relationship to climate in Sub Saharan Africa
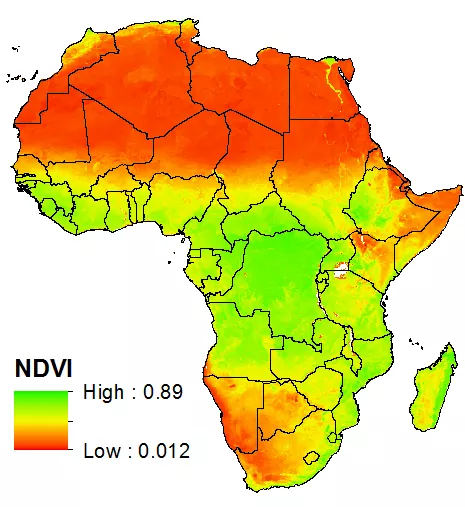
This study involves innovative analysis of large scale time series of remotely sensed images (NOAA AVHRR NDVI, MODIS) and climate data sets for Africa for monitoring of the environment in the aspects of land and water degradation, drought and drivers of land use. Geospatial skills (GIS, RS, data mining, and/or spatial statistics) and tools (TIMESAT, R, MATLAB and arcGIS) are applied Phenological parameters (SOS, EOS, maxNDVI, cumNDVI), Vegetation indices (NDVI, VCI), climate indices (SPEI) to unravel environmental change concerns in Sub Saharan Africa. Biophysically resilient landscapes with similar seasonal trends of ecosystem functioning, breaking points or hot spots will be characterized and mapped to parse out variation due to local and seasonal influences.
Contact information
Petter Pilesjö
Email: petter [dot] pilesjo [at] gis [dot] lu [dot] se (petter[dot]pilesjo[at]gis[dot]lu[dot]se)